Dynamic Compilers part 2
C++ method call
each object has a pointer to a vtable, which is a table of function pointers to all the virtual functions
each derived object has its own vtable, which has the same offsets for all the common virtual functions
to find the code takes two dereferences
- find the vtable (one per class) (one load)
- at a fixed offset (determined by the virtual function name) find the code (second load)
a python example
more flexible
- find the hash table (one per instance)
- lookup the virtual function in the hash table
class Thing:
    def __init__(self, kind):
        self.kind = kind

thing = Thing('car')

def honk(self):
    print(f"{self.kind} says Honk")

thing.honk = honk.__get__(thing)  ## add a method dynamically to one instance

thing.honk()  ## call it
honk.__get__(thing) returns a bound method, when this method is called thing is passed as first argument
dynamic chunks
So far:
- run interpreter or tier 0 compiler
- collect statistics on call counts or branch counts
- when count is high enough recompile the hot functions
- specialize the hot functions based on common values
The unit of compilation is the static function
an alterative is called trace compilation
- run interpreter or tier 0 compiler
- collect the statements executed (no not collect control flow)
- this produces a linear trace of instructions
- recompile the trace using optimizations like value numbering
- if the next time the code executes, it takes a different path, fix things up
trace compilation 0
In a linear trace the number of assumptions you’re making accumulates as you execute [towards the end of the trace you have the most assumptions built up]
If you have an always-taken control flow, e.g. some virtual function call that’s always calling the same actual function, a tracing compiler will treat all back-to-back branches as one set of straight line code
execute this all back to back, and, whenever convenient, check whether any of those assumptions were wrong”
cold path
On the “cold path” – again, when it’s convenient undo all the inapplicable things if it turns out the branches weren’t true
Called a “bailout” [“bailing out” of the trace]
At a bailout there is new information. something you didn’t observe when you were tracing
You trust that everything you’ve trace is going to happen, it’s all going to well, and you’re going to be able to optimize for it
But then at runtime, when convenient, you’re going to check, and then bail if you were wrong, and have the rollback on the cold path
So the hot path, the one you’re pretty sure is going to execute, is quite optimal
trace compilation 2
tracing jit: extract a hot path (not a function)
Hot paths are compiled as a single basic block, but the path might go through a call
gamble: next execution starting at this point, go the same way, no branches leave the path
generate machine code for hot paths interpret the rest of the program
unlike specialization, tracing assumes the same path but not the same values
an example (x = 42)
function main(x){
   y = x +1
   if x <100 {
      z = f(y)
   } else {
      z = g(y)
   }
   return z
}

function f(a){
   return a -1
}
- y = x +1
- guard(x < 100)
- a = y
- z = a - 1
- return z
guards at divergence, guards never return
optimize assuming guards are true, ok to be slow if guard is false
move guards up
why is this a good idea?
. . .
- fail fast
- longer region to optimize
use local value numbering
- guard(x < 100)
- y = x + 1
- a = y
- z = a - 1
- return z
how do this in Bril?
3 new operations (sort of like out-of-order instructions)
- speculate - Enter a speculative execution context. No arguments.
- commit - End the current speculative context, committing the current speculative state as the “real” state. No arguments.
- guard - Check a condition and possibly abort the current speculative context. One argument, the Boolean condition, and one label, to which control is transferred on abort.
example
b: bool = const false;
v: int = const 4; v == 4
speculate; v: int = const 2; v == 2 (speculate state) guard b .failed; v == 2 (speculate state) commit;
.failed: print v; v == 4
implementation
you can add a tracer to an interpreter
In a lot of language environments you’ll have an interpreter that’s executing “op at a time”
hook in a tracer which observes what the interpreter is doing and “make some machine code on the side” based on how the interpreter ran
you can implement just a subset of the operations [ed: you might call this property “compiler completeness” for your op set
common bytecode operations
implement only the common ones and simply end the trace when you hit one that was not implemented, because it was uncommon
You can build up this trace JIT-ing capability over time, because the system is built with this assumption you can bail out of the trace for whatever reason and go back to thr interpreter
an example
Could imagine making a JIT that just: Covered MULs and ADDs and could make fused/composite MUL/ADD bytecode combinations
Specialize that for one common type; e.g. if you have many types in your language, could support that just for integer types, or just for FP ops e.g. if it were numerical code, and then just bail if any other types showed up at runtime;
trace invariants: suppose traces call to other traces;
trace1 set of ops A, trace2 with set of ops B and we see a transfer from A to B
make sure that the assumptions between those two things are lining up – called trace fusion
know the invariants (i.e. “what must be true”) on the exit from A and the entry to B are lining up / compatible with each other
method inlining
In trace compiler you just execute through methods
Inlining kind of the natural path of compilation when doing trace compilation – just linear execution where the jumps/calls/returns simply disappear
tail duplication
it is common that multiple traces have a common tail
for() {
  if op_Eq{
     op1
   } else {
      op2
   }
}
op_t
op_a
op_i
op_l
trace0:  op_eq quard\true  op1 op_t op_a op_i op_l

trace1:              \false op2 op_t op_a op_i op_l
two traces with the same ending, could generate
one copy of the tail- with arguments showing the header
two copies of the tail- frozen header
adding traces to bril
How to modify the reference interpreter (warning typescript!)
brili
there are two functions to consider
- evalFunc interprets a function by calling evalInstr on each instruction
- evalInstr interprets one instruction, large case statement for each instruction
print instructions as they execute
- figure out when to start and when to stop
- how to print instructions (modify evalInstr by printing instructions) console.log(instr)
you have to optimize the trace and put it back
traces and users
when a trace works well- it looks amazing - it finds the inner loop and optimizes even through libraries
but users find in hard to understand what the compiler did,
a tiny source change can make a big trace change
hard to fit in a debugger
security is a problem
pytorch 2.0
ml frameworks have two modes
Eager Mode
- Preferred by users
- Easier to use programming model
- Easy to debug
a + b + c executes two calls to torch.add (if they are tensors)
no place to optimize, allows any kind of python, and any control flow
- PyTorch is a primarily an eager mode framework
Graph Mode
- Preferred by backends and framework builders
- Easier to optimize with a compiler
- Easier to do automated transformations
construct a graph with two add nodes and 3 input nodes, then execute the graph
easy to optimize, only graph nodes allowed, no control flow
Main optimization is fusing operations to avoid memory copies
how does the compiler fit
in Eager mode there is only a library - no compiler
if you have a matmul followed by an activation function, it is up to the developer to notice that the memory traffic is more expensive then the activation and its up to the developer to know there is another pytorch call (2000 different calls) which does the combined operation and it is up to the developer to change the code
if graph mode (compiler writers call this defered or late) the operations get recorded (not executed) and only get executed when we need the result
PyTorch’s Many Attempts at Graph Modes
torch.jit.trace
- Record + replay
- Unsound
- Can give incorrect results because it ignores Python part of program
torch. jit.script
- AOT parses Python into graph format
- Only works on ~45% of real world models
- High effort to “TorchScript” models
- PyTorch Models Are Not Static Graphs
PyTorch users write models where program graphs are impossible
Convert tensors to native Python types (x.item(), x.tolist(), int(x), etc)
Use other frameworks (numpy/xarray/etc) for part of their model
Data dependent Python control flow or other dynamism Exceptions, closures, generators, classes, etc
torch xla
defered execution. rather then do the graph operation, just save it and execute as late as possible
very slow, big performance cliffs
torch.compile(model) - converts a pytorch eager program to a graph
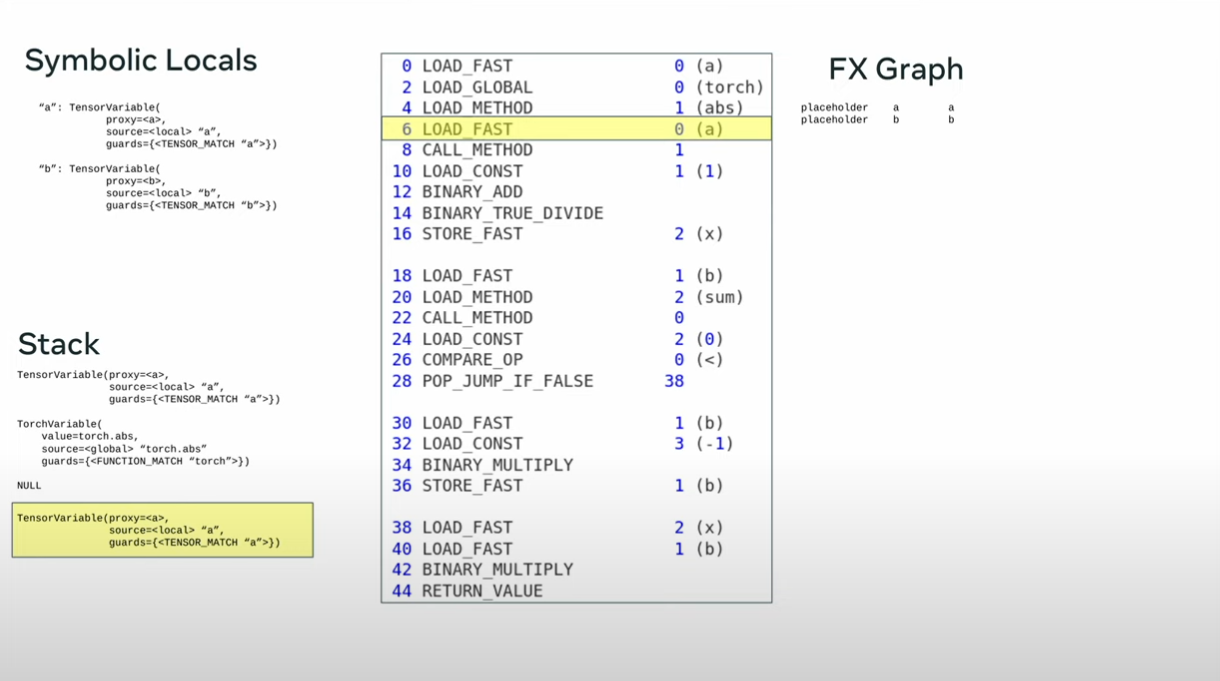
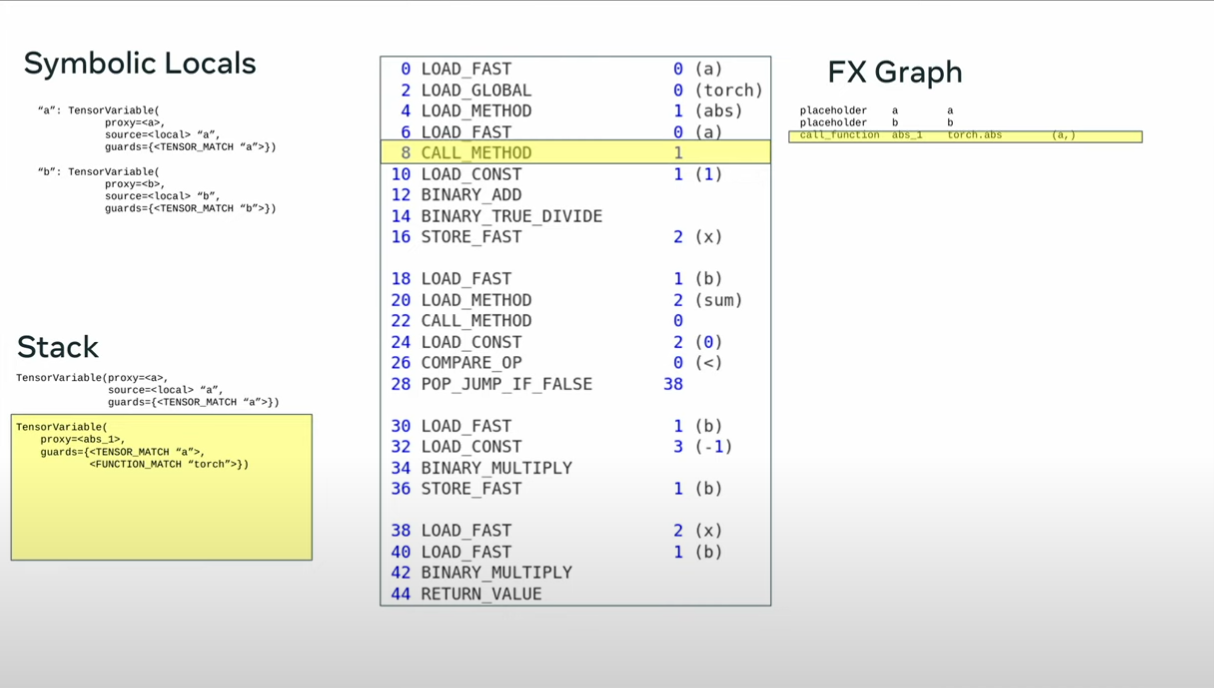
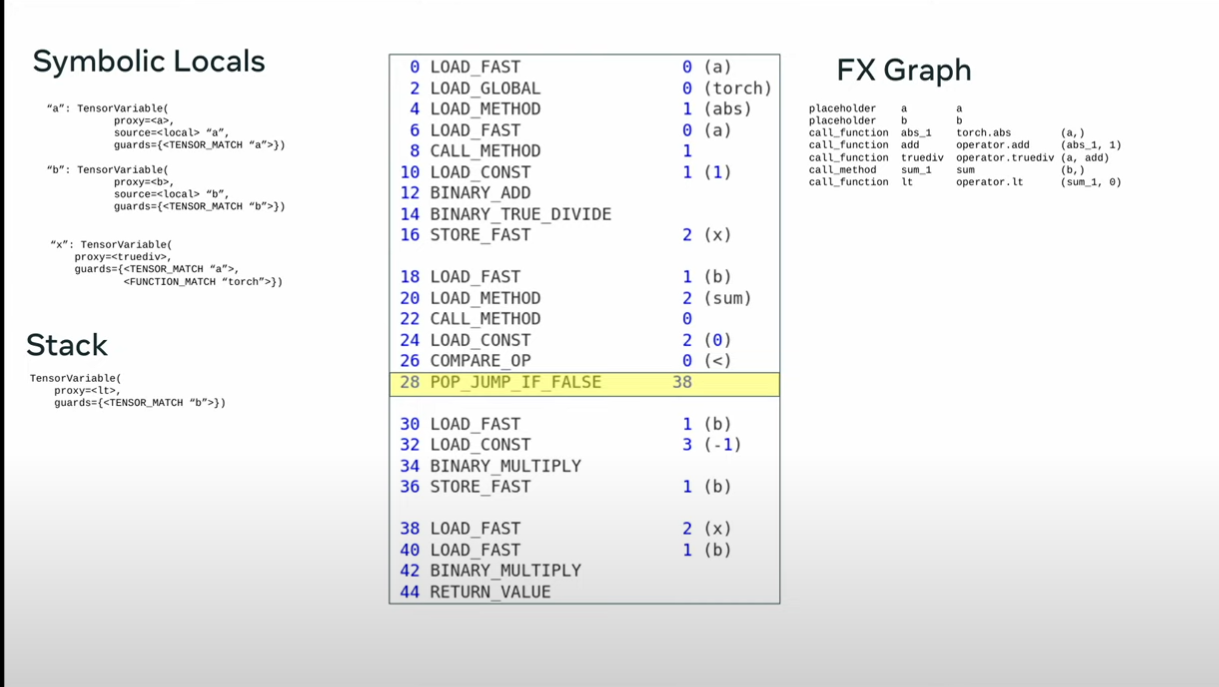
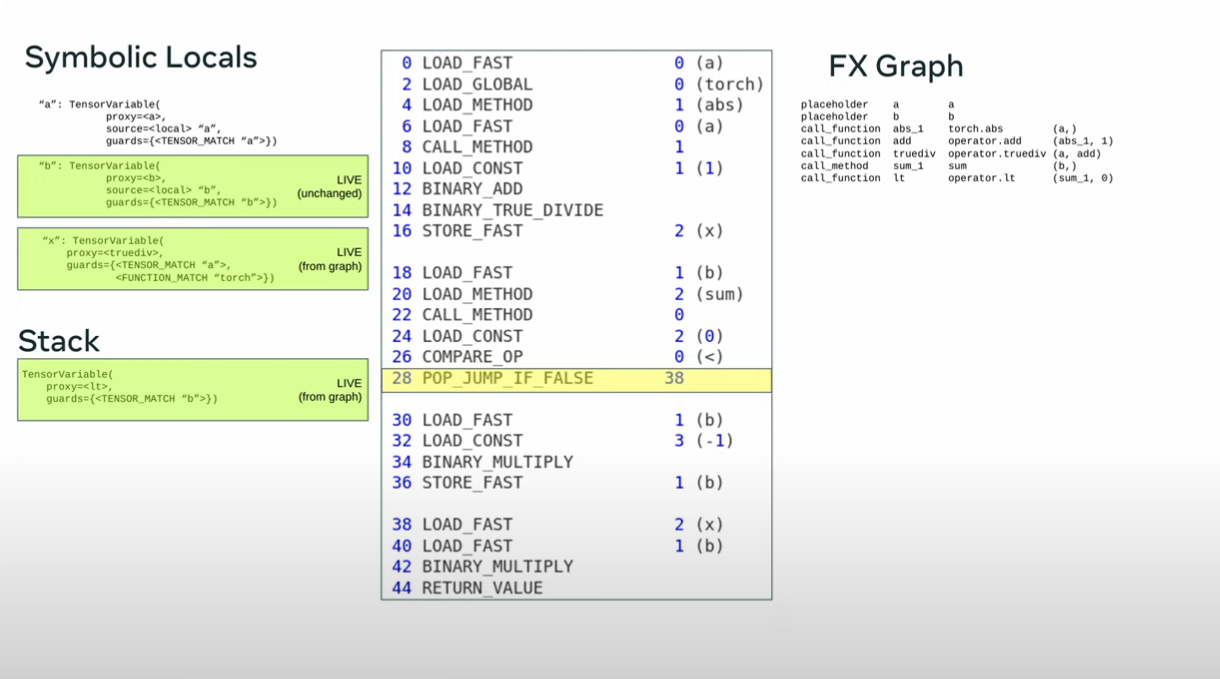
torch.dynamo - which dynamically captures Python code execution and creates a static computational graph.
torch.Inductor- compiler that optimimzes static computation graphs
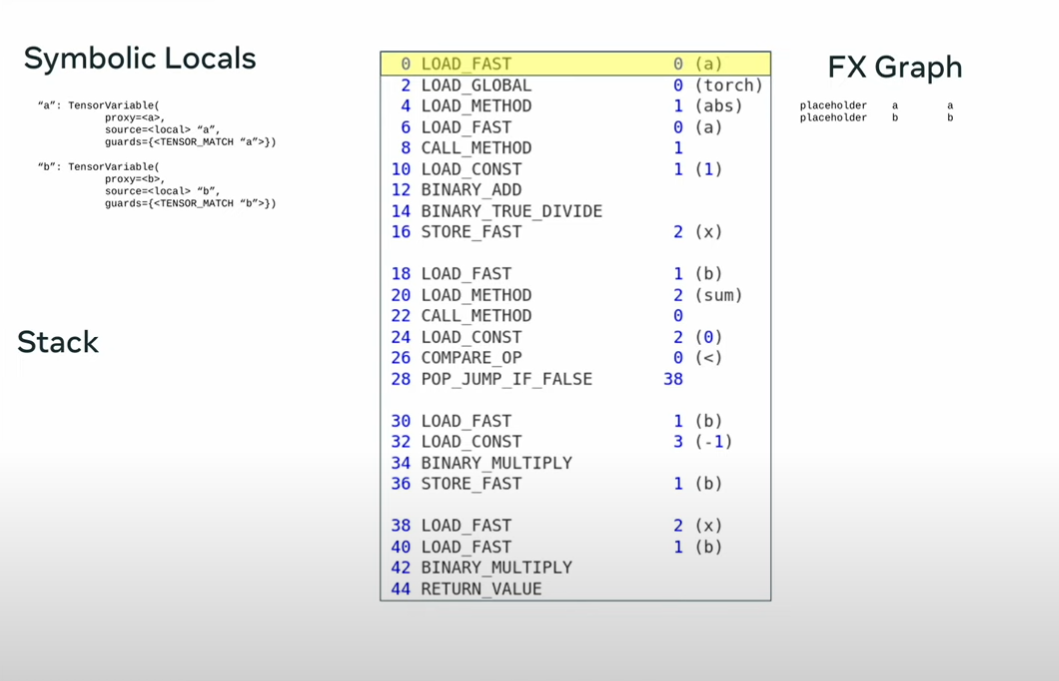
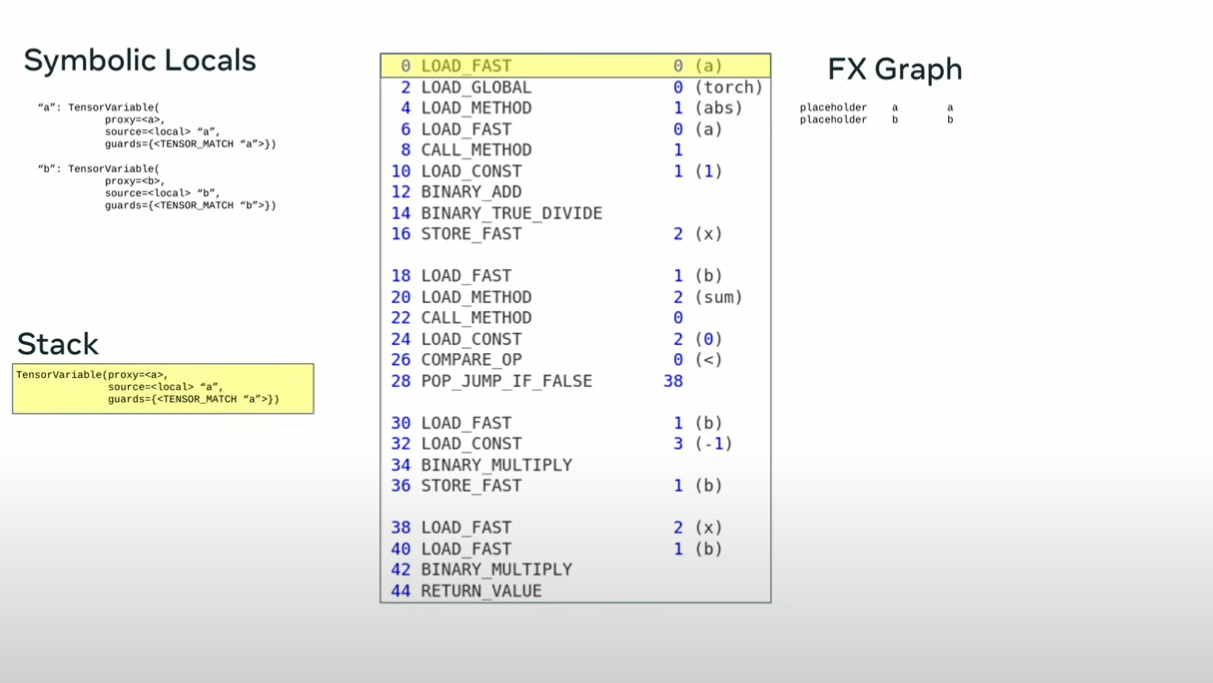
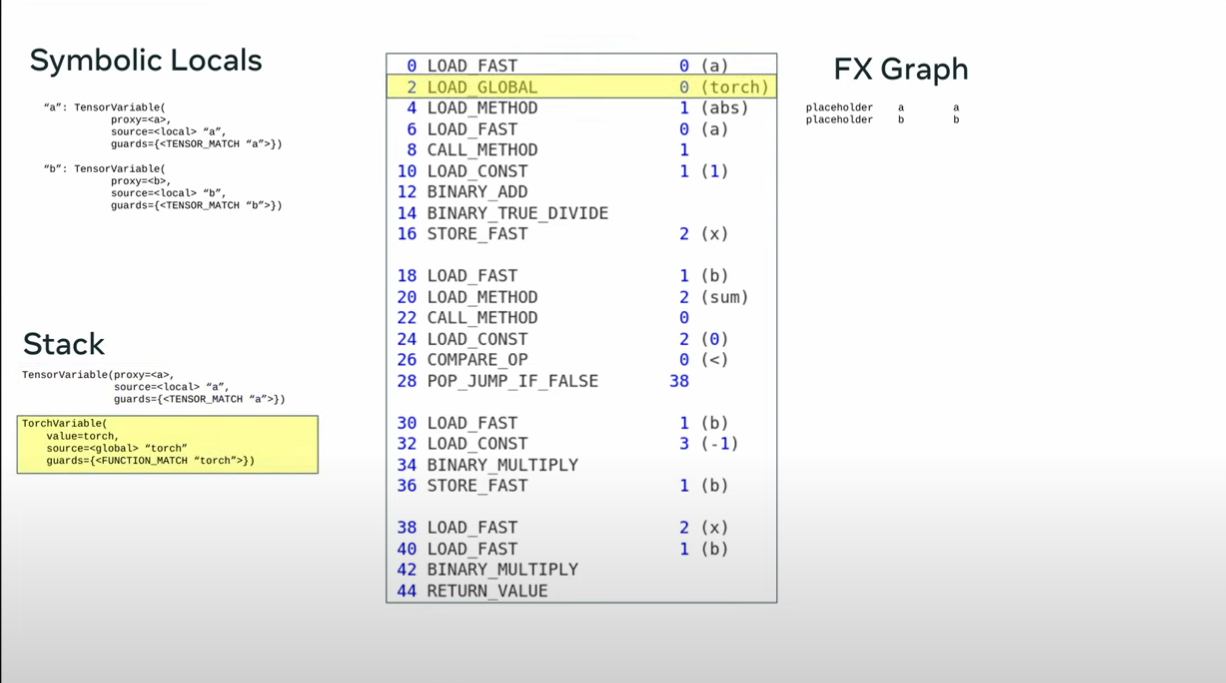
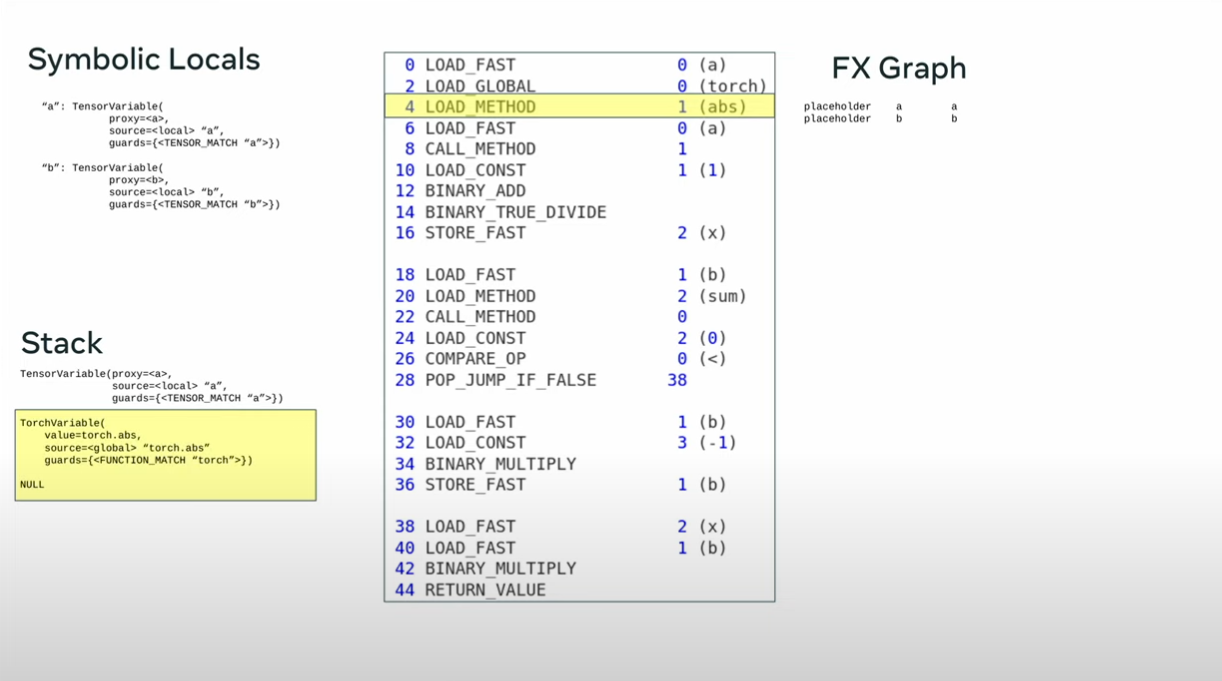
dynamo
import torch
from typing import List

import torch._dynamo
torch._dynamo.config.suppress_errors = True

def my_compiler(gm: torch.fx.GraphModule, example_inputs: List[torch.Tensor]):
    print("my compiler() called with fx graph")
    gm.graph.print_tabular()
    return gm

@torch.compile(backend=my_compiler)
def toy_example(a,b):
    x = a / (torch.abs(a)+1)
    if b.sum() < 0:
        b  = b * -1
    return x *b

for _ in range(100):
    toy_example(torch.randn(10), torch.randn(10))
output
def toy_example(a,b):
    x = a / (torch.abs(a)+1)
    if b.sum() < 0:
        b  = b * -1
    return x *b
opcode         name    target        args
------       ------  ---------    -----------
placeholder    l_a_    L_a_         ()
placeholder    l_b_    L_b_         ()
call_function  abs_1   <abs>        (l_a_,)
call_function  add     <add>        (abs_1, 1)
call_function  x       <truediv>    (l_a_, add)
call_method    sum_1   sum          (l_b_,)
call_function  lt      <lt>         (sum_1, 0)
output         output  output       ((x, lt),)
------       ------  ---------    -----------
placeholder    l_b_    L_b_         ()
placeholder    l_x_    L_x_         ()
call_function  b       <mul>        (l_b_, -1)
call_function  mul_1   <mul>        (l_x_, b)
output         output  output       ((mul_1,),)
------       ------  ---------    -----------
placeholder    l_x_    L_x_         ()
placeholder    l_b_    L_b_         ()
call_function  mul     <mul>        (l_x_, l_b_)
output         output  output       ((mul,),)
implementation
python builds a frameObject (pointer to codeObject + arguments)
passes this to eval
codeObject allows for extra user data and for a user function to be called between the frameObject and eval
This makes it easy to add a custom JIT
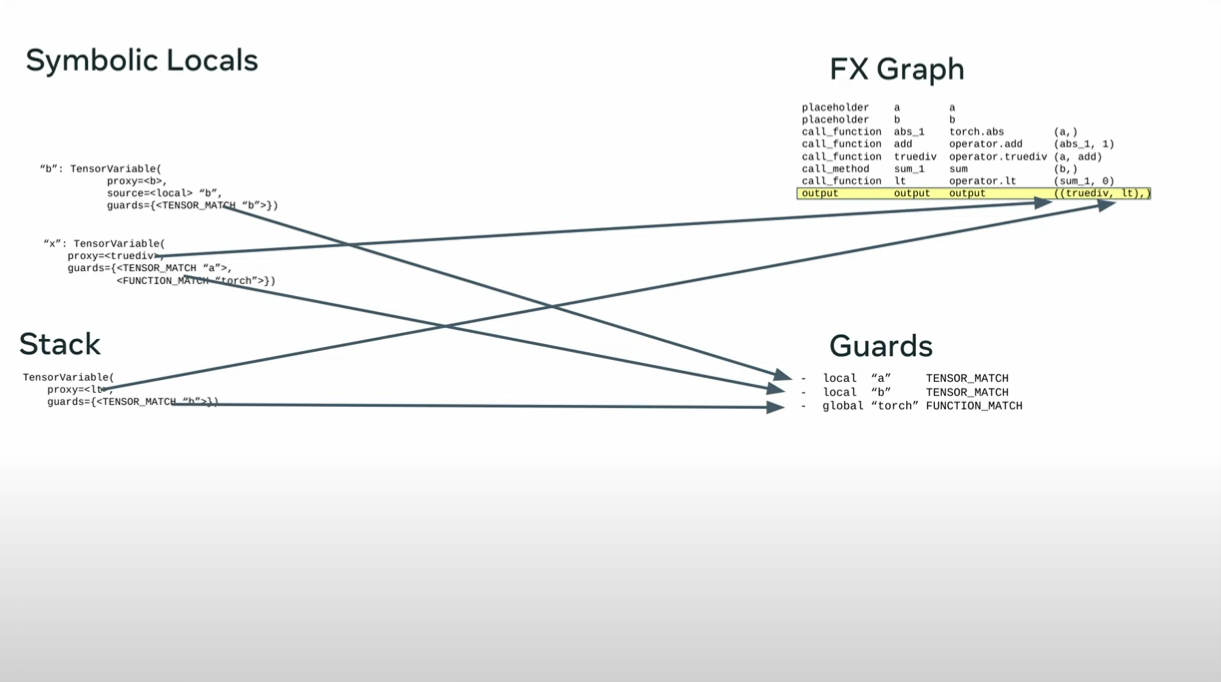
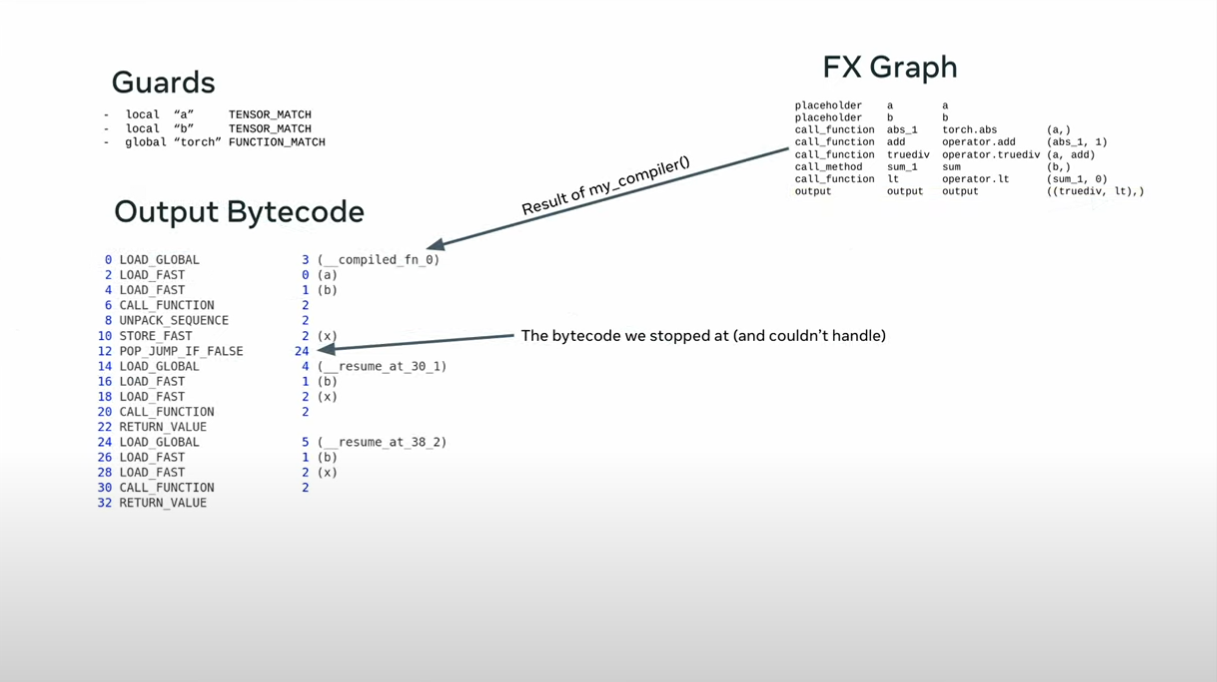
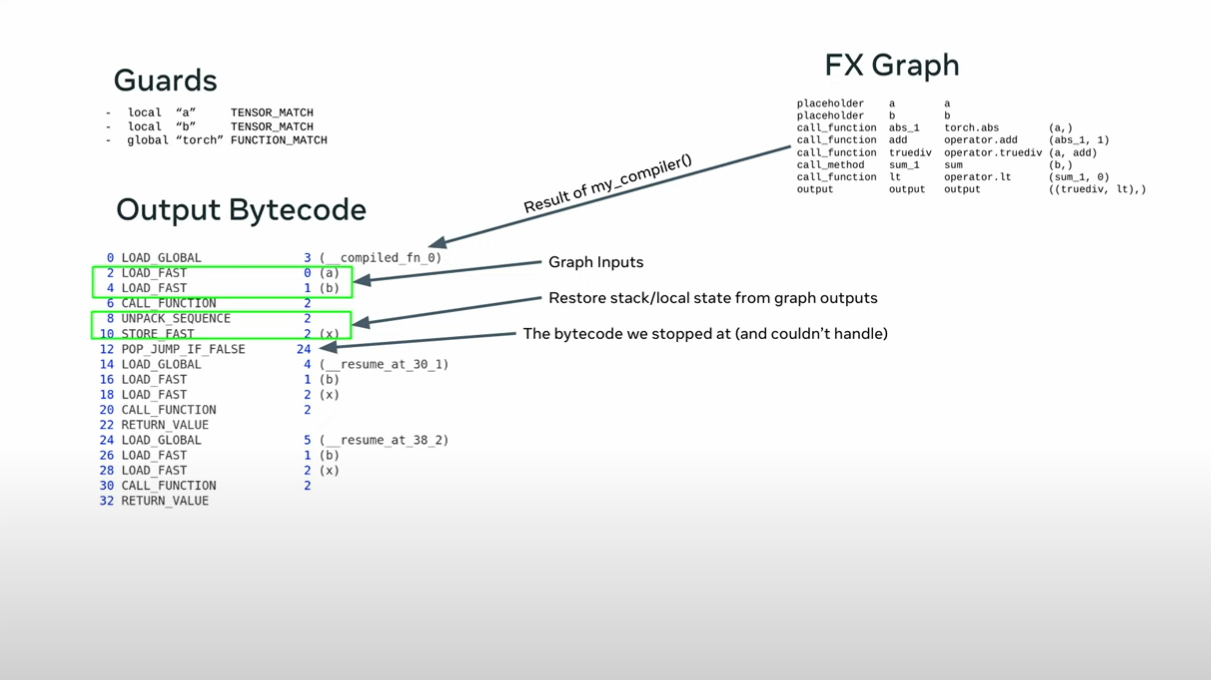
split the function into two parts - the python part and the torch part
This is reused if the guards pass
pytorch example 1
def toy_example(a,b):
    x = a / (torch.abs(a)+1)
    if b.sum() < 0:
        b  = b * -1
    return x *b

for _ in range(100):
    toy_example(torch.randn(10), torch.randn(10))
sometimes the sum is negative but not always
graph
| placeholder |
l_a_ |
L_a_ |
() |
| placeholder |
l_b_ |
L_b_ |
() |
| call_function |
abs_1 |
<built-in method abs of type object at 0x728736add8a0> |
(l_a_,) |
| call_function |
add |
|
(abs_1, 1) |
| call_function |
x |
|
(l_a_, add) |
| call_method |
sum_1 |
sum |
(l_b_,) |
| call_function |
lt |
|
(sum_1, 0) |
| output |
output |
output |
((x, lt),) |
code
def toy_example(a,b):
   (x,lt) = call1(a,b)
   if lt:
      f1(b,x)
   else:
      f2(b,x)

def f1(b, x):
   b  = b * -1
   return x *b

def f2(b,x):
   return x *b
guards:
check_tensor(L[‘a’], Tensor, torch.float32, size=[10], stride=[1]) check_tensor(L[‘b’], Tensor, torch.float32, size=[10], stride=[1])
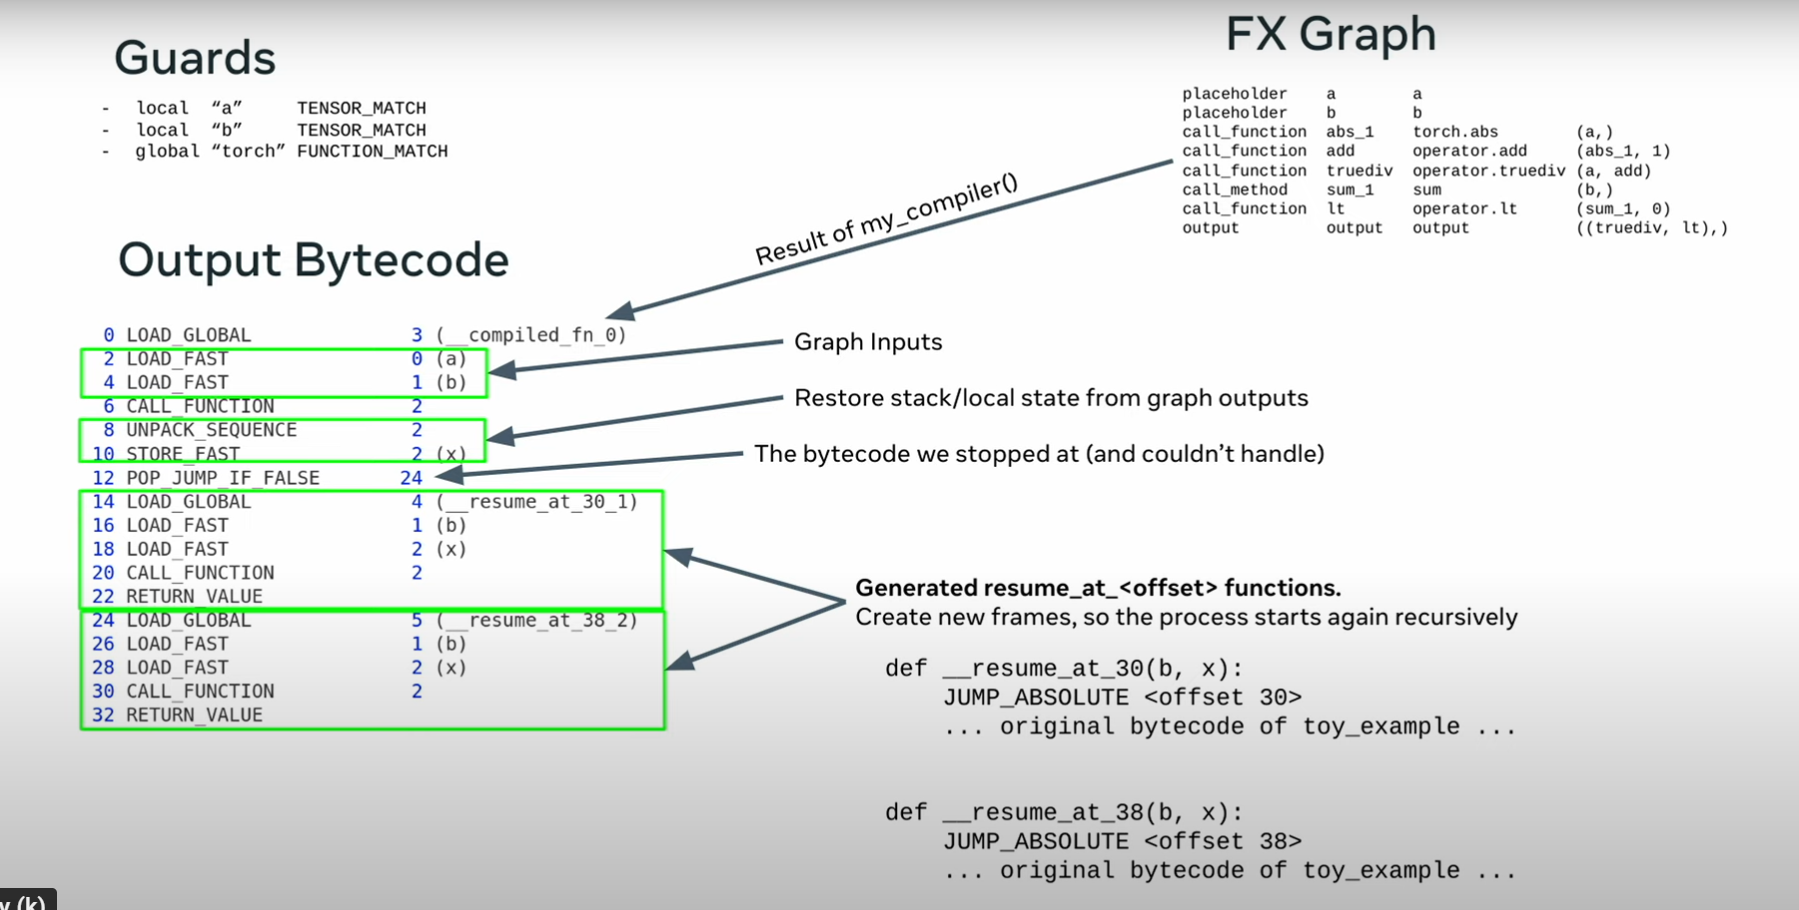
walk the byte code again for f1
b  = b * -1
return x *b
TRACED GRAPH
| placeholder |
l_b_ |
L_b_ |
() |
{} |
| placeholder |
l_x_ |
L_x_ |
() |
{} |
| call_function |
b |
|
(l_b_, -1) |
{} |
| call_function |
mul_1 |
|
(l_x_, b) |
{} |
| utput o |
utput o |
utput ( |
(mul_1,),) { |
} |
other branch
guards: check_tensor(L['b'], torch.float32, size=[10], stride=[1])
        check_tensor(L['x'], torch.float32, size=[10], stride=[1])
TRACED GRAPH
| aceholder l_ |
x_ L_ |
x_ () |
{} |
|
| aceholder l_ |
b_ L_ |
b_ () |
{} |
|
| ll_function mu |
l <b |
uilt-in function mul> (l |
x, l_b_) {} |
|
| tput ou |
tput ou |
tput (( |
mul,),) {} |
|
check_tensor(L[‘b’], torch.float32, size=[10], stride=[1]) check_tensor(L[‘x’], torch.float32, size=[10], stride=[1]) # return x *b # mp/ipykernel_1179164/26
linear traces
Dynamo removes all control flow, if/else, loops, exceptions
specializes (bakes in) all non-tensor objects (numbers, strings, classes )
@torch.compile
def fn(f,n):
  y = x ** 2
  if n >= 0:
    return (n +1)* y
  else:
    return x /y

x = torch.randn(200)
fn(x,2)
def forward(l_x_: torch.Tensor):
   y = l_x_ ** 2
   mul 3*x
   return (mul,)
special cases
Trace integers symbolically
by default it specilizes on every integer in the graph but if a subsequent vall the value changes it traces symbolically but 0 or 1 are always speciaized
multiple traces
import torch
from typing import List

import torch._dynamo
torch._dynamo.config.suppress_errors = True

def my_compiler(gm: torch.fx.GraphModule, example_inputs: List[torch.Tensor]):
    print("my compiler() called with fx graph")
    gm.graph.print_tabular()
    return gm

@torch.compile(backend=my_compiler)
def toy_example(a,b):
    x = a / (torch.abs(a)+1)
    if b.sum() < 0:
        b  = b * -1
    return x *b

for _ in range(100):
    toy_example(torch.randn(10), torch.randn(10))


import torch
from typing import List

import torch._dynamo
torch._dynamo.config.suppress_errors = True

def my_compiler(gm: torch.fx.GraphModule, example_inputs: List[torch.Tensor]):
    print("my compiler() called with fx graph")
    gm.graph.print_tabular()
    return gm
implementation
pep 523, allows python function to see unevaluated frames, function + arguments
normally just calls the function